
Candlestick Patterns Cheat Sheet
Candlestick patterns
Candlestick patterns are a widely used tool in technical analysis, which is a method of analysing financial markets, particularly in stocks, forex, and commodities. These patterns help traders and analysts to make predictions about future price movements based on historical price data.
Bearish engulfing
This pattern consists of two candlesticks: a smaller bullish candle, followed by a larger bearish candle. The second candle engulfs the range of the preceding one.
Bullish dragonfly doji
The open and close prices of this candlestick are equal or very close to the high with a relatively long price range.
Inside bar (bearish)
Two bar candlestick pattern where the 2nd bar has a higher low and a lower high than the preceding bearish candlestick. Potential indication of a continuation of the downtrend.
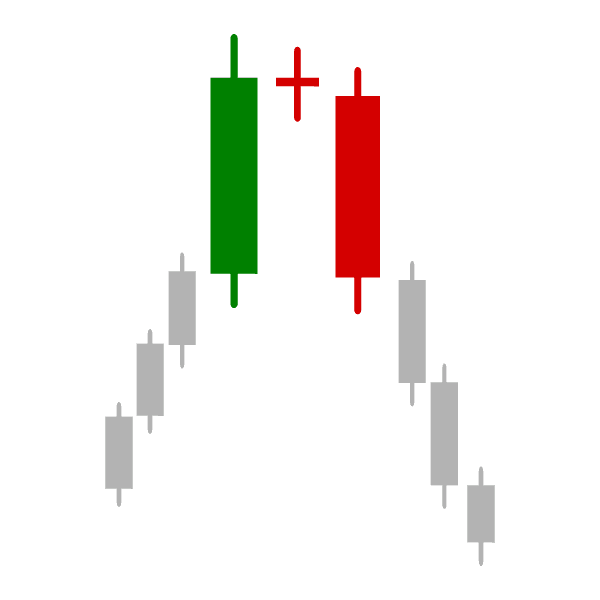
Bearish abandoned baby
The first bar of this pattern is a large green candle, followed by a "doji" candle that gaps up and finally a large red candle that gaps down.
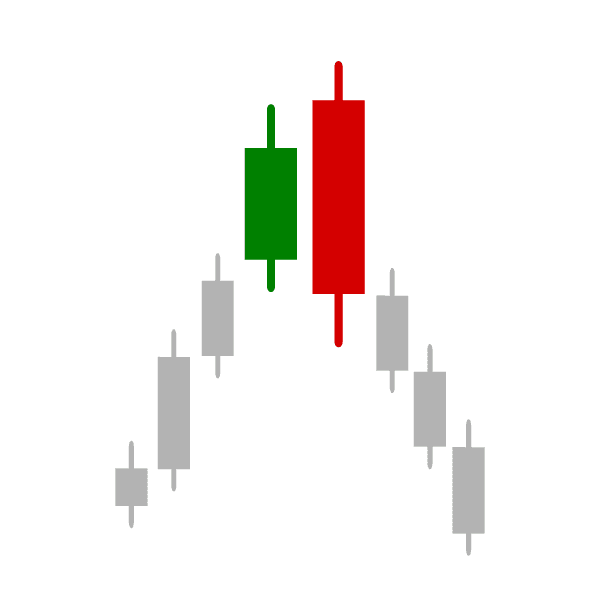
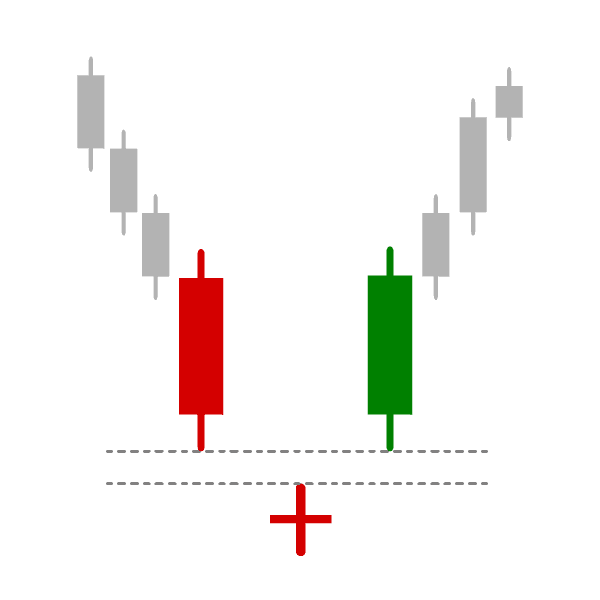
Tweezer top
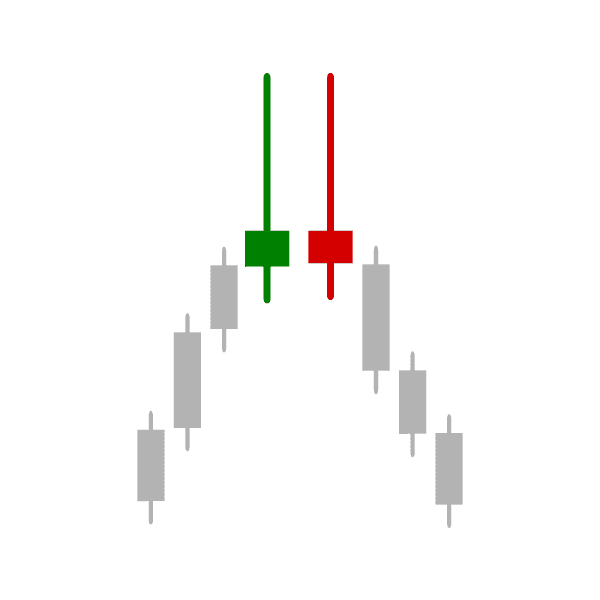
Two bar candlestick pattern composed of a bullish then bearish candlesticks, both with relatively equal highs and long wicks. Indicates a potential price reversal.
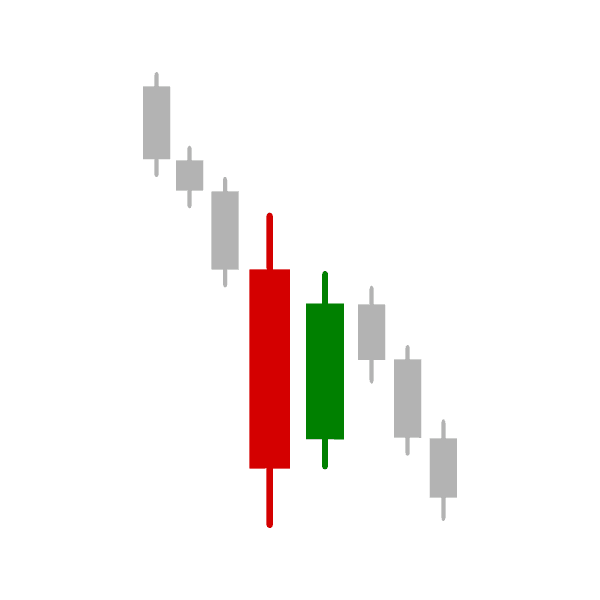
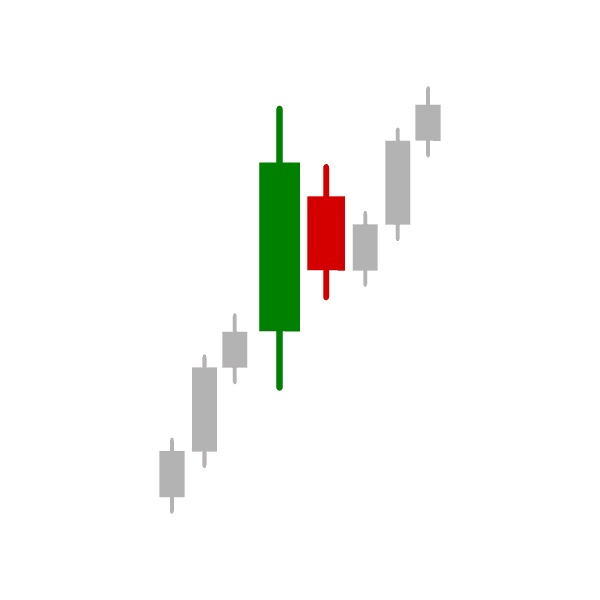
Bullish engulfing
This pattern consists of two candlesticks: a smaller bearish candle, followed by a larger bullish candle. The second candle engulfs the range of the preceding one.
Morning star
Three candlesticks pattern and usually occurs at the end of a downtrend indicating a potential reversal in price.
Evening star
Three candlesticks pattern and usually occurs at the end of a uptrend indicating a potential reversal in price.
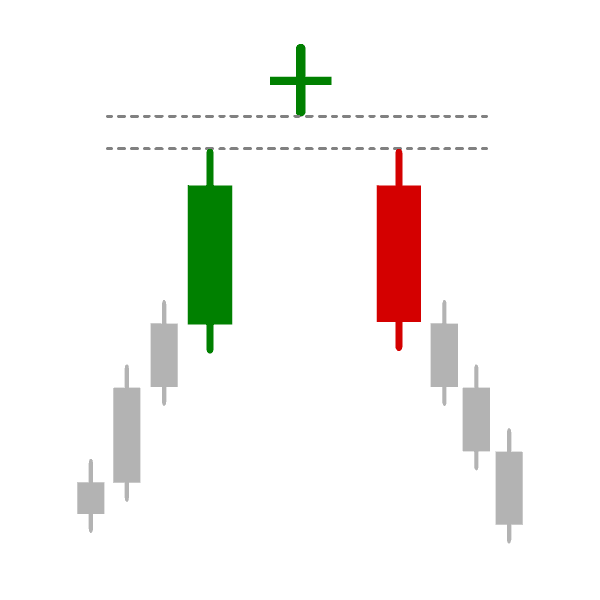
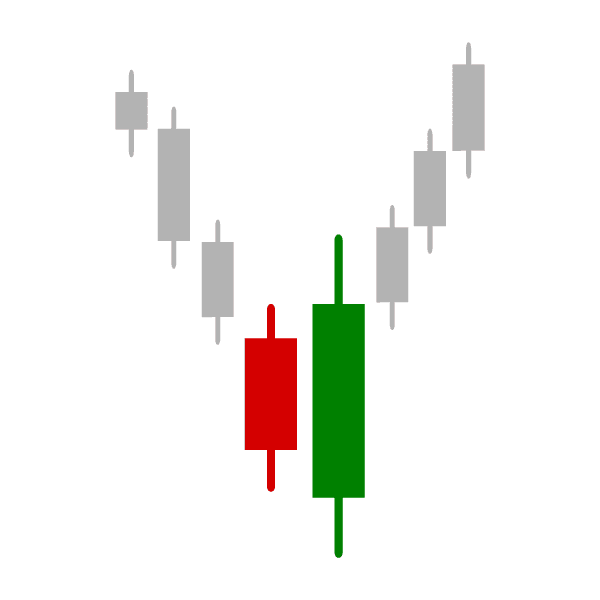
Tweezer bottom
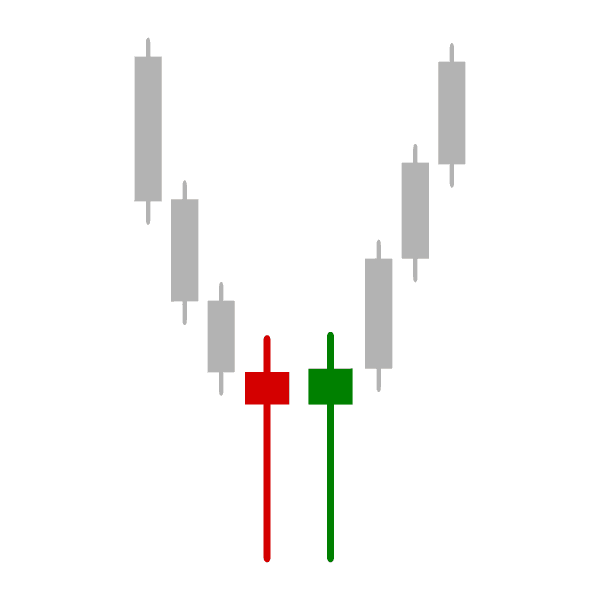
Two bar candlestick pattern composed of a bearish then bullish candlesticks, both with relatively equal lows and long wicks. Indicates a potential price reversal.
Bearish gravestone doji
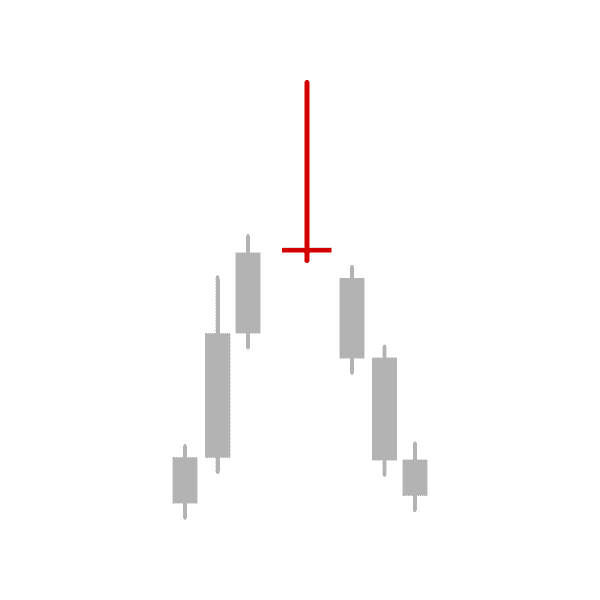
The open and close prices of this candlestick are equal or very close to the low with a relatively long price range.
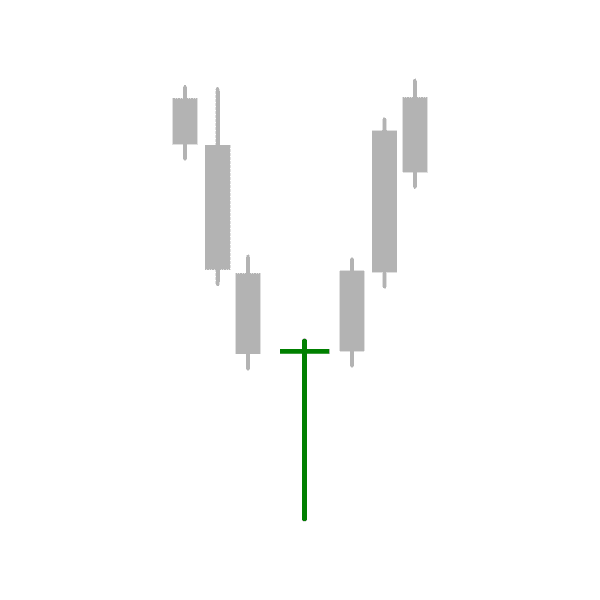
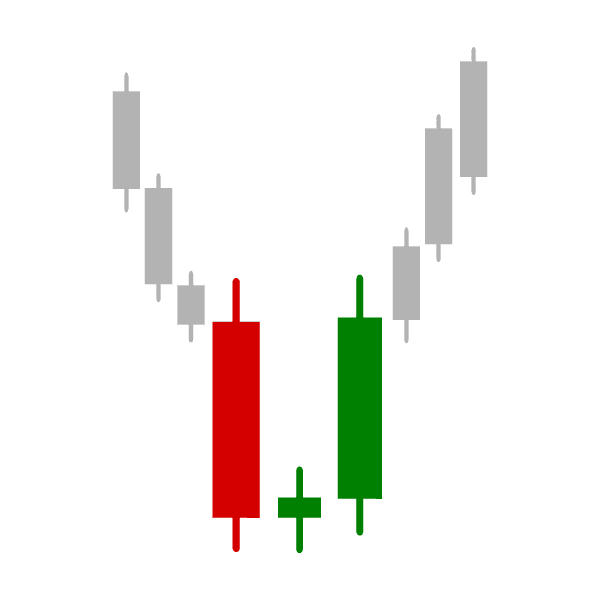
Bullish abandoned baby
The first bar of this pattern is a large red candle, followed by a "doji" candle that gaps down and finally a large green candle that gaps up.
Inside bar (bullish)
Two bar candlestick pattern where the 2nd bar has a higher low and a lower high than the preceding bullish candlestick. Potential indication of a continuation of the uptrend.
Disclaimer: The content of the fatdaytrader.com website and any posted on our blog is intended for educational purposes only and is not to be construed as financial advice. Trading the financial markets carries a high level of risk and is not suitable for all investors. When trading, you should consider your investment goals, experience, and your appetite for risk. Only trade with funds you are prepared to lose. Like any investment, there is a possibility that you could sustain losses of some or all your investment whilst trading. You should seek independent advice before trading if you have any doubts. Past performance in the markets is not a reliable indicator of future gains.
fatdaytrader.com takes no responsibility for loss incurred as a result of the content posted on our website or blog. By using this website you acknowledge that we are not providing financial advice and our content is for your information and educational purposes only.
©2026 fatdaytrader.com. All rights reserved.